Statistic Based Verification on Computer System Validation
Let’s discuss in this article the potential use of statistical analysis to accomplish a computer system validation.
Rapid Changes
While the validation of computer systems has been established for some time now, we currently experience a time of rapid changes of computer systems in the regulated environment, such as
- The switch from static waterfall models to agile methods
- The introduction of more Cloud services with typical challenges like multiple mandatory updates per year
- The introduction of big data and machine learning applications, which represent different models of software design.
One common challenge these systems share is a significantly higher rate of changes and iterations than the traditional GxP-relevant application, which is often set up, validated once and kept in this steady-state for as long as possible. Different approaches are being introduced to tackle these challenges; however, in this article, we will focus on the potential of statistical analysis.
Guidance on statistics
Within the Computer System Validation framework, there is little actual guidance on the use of statistical methods. The one place they are mentioned in industry-standard literature GAMP 5 is data verification within data migration projects. However, looking a bit further, statistics are more prevalent in other areas of the regulated environment. The FDA guidance for Process Validation, for example, recommends the use of sound statistical methods for continuous process verification. This concept finds its counterpart in the monitoring of computer systems.
At the end of this article, we will give an outlook of possible use cases. But first, we will have a look at a practical example in data verification.
Data migration – Verification
When retiring a system and switching to a successor, it will often become necessary to transfer over data as well. The expectation is that the process and tools used are qualified for this job and that data correctness is verified. While a 100% technical verification of the data points is often possible, for example utilizing checksums, this may not be enough to cover all risks. Examples might be file types being incompatible with the new system, data types or encoding changing, or wrong field mappings. It, therefore, makes sense to introduce manual verification as well. GAMP 5 suggests using statistical sampling as a 100% verification is usually impractical for a more extensive data set; usually, the next step is to consult the referenced ANSI or ISO standard, which contains many pages of different tables for different situations. Then selecting a reasonable table and draw a sample of defined size. However, this can lead to two problems:
- The standards are not an easy read. If you are not statistically trained, you may select the wrong table, deviating from the regulatory expectations and being susceptible to audit findings.
- While the standards do give concrete numbers, they do not include a conclusion statement. So, if questioned how likely, an error is, one can only answer: we were following industry-standard rather than having a quantified answer.
So let us explore what is happening with a toy problem, which illustrates the statistical model behind the sampling approach.
Toy Problem – Flipping a Coin
Imagine, in a game of coin flips, the coin always shows heads. You suspect the coin is rigged, i.e., has heads on both sides. How often do you have to flip the coin, to be reasonably sure that the game is rigged?
This question is analogous to the data verification problem, where we want to answer: How many data points do I have to inspect to be reasonably confident that there are no wrong data points?
Back to our toy’s problem, assume the probability of tails to be 50% (as grounds of calculation only, we want to show that the probability is 0% instead) and reasonably certain shall mean that the uncertainty is 90%.
If the coin had a side showing tails, repeating the coin flipping over and over again, the probability of not getting tails would fall drastically: Getting heads once has a probability of 50%, getting heads twice has a probability of 25%. See the diagram for more details.
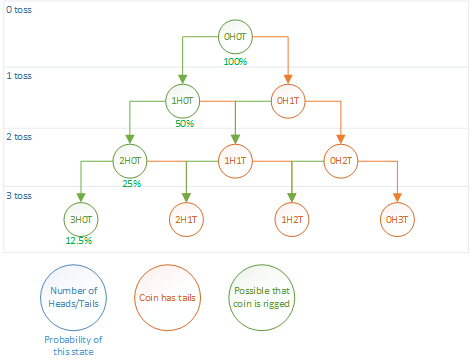
After the third flip, we can see that we are already left with an uncertainty of only 12.5%. One more toss, and we can be reasonably sure (~94%) that the dice are rigged and never shows tails.
So let us compare this to our data migration problem:
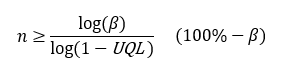
When we formalize the process in the toy problem above, we find a formula for getting the right sample size:
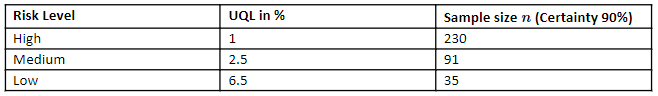
An example with a mapping of risk to UQL to sample size can be found in the table below.
With this, we can also formulate a correct conclusion statement:
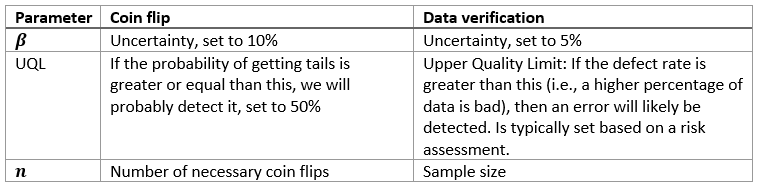
If the defect rate is greater than UQL, then we will detect an error in a sample of “n” with a certainty of (100%−β).
Sampling process
When looking at the complete sampling process, there are a few other things to watch out for. E.g., as a prerequisite for this model, the data must be independent and identically distributed, which can often be solved by drawing the data points at random. Another important aspect is that once we have found an error, the same error appeared outside the sample as well, so simply fixing it will not be enough. Instead, we must identify the root cause; all instances of the error must be found and fixed.
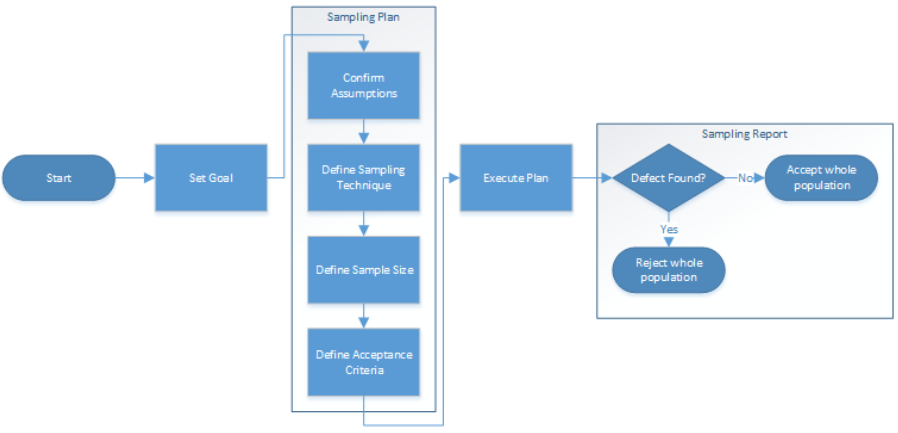
The data migration process then follows the typical approach of formulating a plan, executing it, and reporting it. You can find a high-level example in the following diagram.
Conclusion and Outlook
While the example toy problem is specific to sample testing, it does demonstrate two important points:
- Often, the underlying statistical model is not very complex (in this example, comparable to a coin flip). It does help to involve someone trained in statistics to get clarity on which model to use. Otherwise, we risk having a weakness in our validation.
- If we can formulate a precise conclusion statement, we can make the result of the statistical analysis tangible, compared to only relying on references. This can also help in future investigations in case problems arise
But statistics will also become more critical outside data migration. Let us go back to the challenges from the beginning and look at potential use cases for statistics:
- Big Data analysis has statistics at its core. Algorithms will be based on known statistical methods. But this also means that verifying these functions requires a statistical approach to confirm them working correctly.
- Cloud validation itself is executed similarly to any other computer system validation. But with the data and potentially functionality not being directly controlled, proper monitoring and continuous verification need to be in place. This can benefit significantly from statistical selection criteria, similarly to continuous verification within process validation.
- Agile development will typically not use statistical analysis at the moment, but with the more significant number of iterations, different aspects like selecting test scope and data or root cause analysis may benefit from statistical approaches.
For any further questions regarding validation, we at GxP-CC are happy to accompany you on your journey.